

Modeling attribution on iOS?
How to navigate the messy world of SKAN, AEM, and probabilistic attribution — plus two practical frameworks to get a clearer picture of campaign performance.
SKAdNetwork (SKAN) was, and still is, the most significant change in the app industry over the past decade. As a UA consultant, I still remember the good old days when we could run multiple value optimized (VO) campaigns on any ad network and achieve positive profitability within 30 days using deterministic attribution.
Yeah, I won’t deny it. Having identifiers for advertisers (IDFAs) was great from a performance perspective but our privacy was seriously attacked by most companies that were promoting their stuff on the internet. The industry needed to evolve after the Facebook-Cambridge scandal and Apple was the fastest and most aggressive player to address this issue by deleting the unique parameter that allowed us to track the behavior of iOS users with 100% accuracy.
At this point, I don’t need to explain how SKAN works. You can find plenty of articles about the topic, including this complete guide to SKAN from Lucas Moscon, one of the biggest experts on this topic and, in my opinion, one of the sharpest minds of the industry.
However, we must highlight how this change has transformed all mobile measurement partners (MMPs) from attribution providers into mere analytics tools, as they now only display the data that ad networks send to them after enriching Apple’s postbacks.
Yes, you read right, the five MMPs that control the market are just displaying what Facebook, TikTok, or any ad network sends to them. The only real alternative to this is Appstack, a project in beta which wants to receive raw postbacks from Apple in order to help advertisers to know the actual performance of their campaigns.
Probabilistic attribution: The perfect umbrella for the storm
Let’s be honest: most UA professionals in the industry don’t use SKAN. They either don’t understand its mechanics or simply can’t work with a data delay of up to 41 days (the maximum time currently required to receive all postbacks in SKAN if you have the delays in mind).
Obviously, this situation is not ideal because of different reasons:
- It demands patience: you start a campaign but you don’t see stable performance until the 3rd or 4th day of spending.
- SKAN data always differs from App Store Connect data, making you think that the campaign does not track all the users that it actually generates.
- Due to the delays in data and the maximum period of tracking of 41 days, companies are forced to build predictive models to estimate users’ long-term value and behavior (which is not 100% accurate).
- The daily budget that you set will determine the data tier that you can reach, and for small companies, this means receiving almost nothing in terms of post-install events.
Marketers like real-time data. Or at least they like having the feeling that they can see how the campaigns are working every day without having to wait 2 days to have the complete picture before making a decision. And once SKAN unleashed the storm, all the ad networks and MMPs started to look for an alternative to SKAN because they knew that.
We first saw companies shifting their budgets towards Android, but that wasn’t enough. The quality gap between the two OSs was too large to justify such a significant budget shift. As a result, they either lost money or missed out on a unique opportunity with Apple’s users.
Then, all the big players started to work on nailing their algorithms to work with the only existing alternative: probabilistic attribution.
This attribution model is perfect because it allows you to report real-time conversions while informing the users that some of the conversions that they see in the dashboard are “modeled by [insert company name]’s technology.” They are basically telling you that the numbers that you see are not real; it is just approximate, and you’ll need to figure out the reality. And the worst part is that MMPs still charge you for each of these “unreal” attributions.
This article won’t explain how probabilistic attribution works. Again, you have plenty of articles from all the companies that use it explaining their models. The only thing you need to keep in mind here is that probabilistic attribution came to offer an alternative solution that perfectly addressed the issue that advertisers have:
- No delays in the data: you can see what the budget you invested that day is bringing to you that exact day.
- No data tiers to reach: you will see modeled conversions regardless of the daily budget that you use.
- Psychologically speaking, you work with inflated numbers, which makes you think that your campaigns are performing much better than before.
What are the main modeling technologies in the market?
In this section, I will not talk about programmatic or DSP partners, although most of them work with probabilistic attribution. I will focus on the classical channels that most companies, regardless of their size, use: Google Ads, TikTok Ads, Meta, and maybe in the last position, Snapchat.
These channels have one common characteristic: they have endless data points from all of us because we all use their services massively, and when you accept their terms and conditions, you accept to be tracked—if and when they respect the regulation about data privacy (spoiler: they never respected that, if you look at previous events like the Cambridge Analytica scandal).
When you have so many data points from your users, building a probabilistic attribution that works quite accurately is less hard. These companies saw how SKAN caused a massive drop in ad spend, and recovering a way to promote iOS apps efficiently was their major goal.
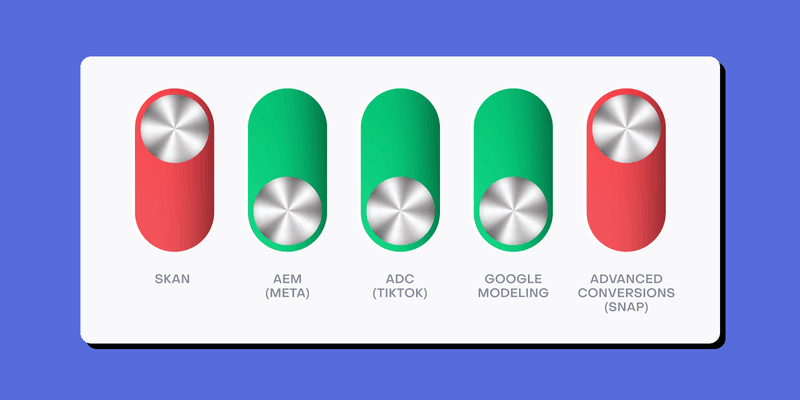
With that said, we have basically a different name for each technology, but they are all doing the same thing at the end:
- Meta & AEM: AEM is the most famous protocol right now because it’s the one that has shown higher accuracy. According to Meta’s documentation, AEM is a protocol that allows for the measurement of web and app events from people using iOS 14 and later devices. Aggregated Event Measurement processing includes privacy-protective measures like removing identifiers, adding differential privacy, and aggregating the data across users before delivering or measuring ads.
I have posted a few case studies about the differences between AEM, SKAN, and the tracked installs by App Store Connect through Custom Product Pages. You can check my LinkedIn profile and draw your own conclusions. From what I’ve seen, the difference between installs in Meta and downloads in App Store Connect (they’re not the same!) is pretty acceptable, and you can easily work with that if you run only Meta as your main ad network. When there are more networks involved, then it’s harder to conclude what’s the reality.
The process to work with AEM is pretty straightforward and simple, whether you work with an MMP or with the Facebook SDK. If you go with an MMP, you just need to enable the toggle for AEM (depending on which MMP you use, the toggle will have a different title) when you set up the Meta connection. And if you go with the SDK, you will be ready by just having the latest version of the SDK.
AEM is independent from SKAN, meaning that you can run campaigns based on the events you map with Meta despite having a SKAN schema or not, because it does not use SKAN. Actually, since they started to send AEM data to the MMPs in October 2024, you can’t check the default SKAN dashboards that MMPs have. You are forced to look for this data by looking at raw CSVs with the postbacks or custom reports where you specifically ask for the SKAN numbers of your AEM campaigns.
Is this a coincidence? Absolutely not. They are billing you for every probabilistic attribution that Meta sends to them, and if you check SKAN, you will ALWAYS see a lower number on that side, which will lead you to ask why you are charged for probabilistic attributions instead of deterministic (SKAN) attributions. And one more thing—it doesn’t matter that you have probabilistic attribution disabled in the app settings within the MMP. If you enable AEM, probabilistic attribution will be enabled by default with Meta (otherwise AEM wouldn’t work). Again, I just expose the facts, but you should draw your own conclusions.
- TikTok & ADC: TikTok has been heavily promoting its Advanced Dedicated Campaign feature, which has been in Beta for more than a year, as the best way to enhance the signals provided by SKAN. According to TikTok, Advanced Dedicated Campaign (ADC) is an iOS campaign type that aims to improve your experience on iOS with reporting and delivery features.
This does not work like AEM. In this case, you really need to have your SKAN schema in place. Instead of working completely separately, ADC is just a technology that TikTok puts on top of SKAN to enhance the data signals that are tracked by the campaigns. In this case, you should expect a slightly higher number of conversions, but it won’t be as much as AEM.
Although this technology can help you, it doesn’t prevent you from using SKAN, and your campaigns will still be based on the information that Apple shares with TikTok through the postbacks. I have also shared some case studies about this on my LinkedIn, so feel free to check them and ask any question you may have!
Before ending this point, I want to highlight that TikTok is working on rolling out its own SDK, which will eventually lead to having the ability to offer a solution like AEM. I would bet anything on TikTok introducing a similar technology as AEM in the upcoming months, so monitor this channel closely because they work well when it comes to rolling out new technologies for advertisers.
- Google’s Modeling Conversions: Our friends from Mountain View decided not to use any cool name for their modeling technology, but they also did their job once the SKAN era kicked off. I really like that Google actually gives a complete explanation about all the data points that they use to make this technology work. You can find all the information and detailed explanations about how Google processes the data while respecting users’ privacy by checking the following link: https://support.google.com/google-ads/answer/12119136?sjid=17513072954145618164-EU
Besides this modeling technology, they also recommend using On-Device Measurement on top as a way to improve accuracy in the modeled conversions.
According to their documentation, this is how the On-Device Measurement feature works: On-device conversion measurement helps measure app installs and in-app actions from your iOS app campaigns. The Google Analytics for Firebase SDK performs on-device attribution using a user’s identity provided by your app’s sign-in experience. The user’s identity is hidden through our on-device conversion approach so that no personally identifiable information ever leaves the user’s device.
Personally speaking, the modeled conversions by Google have been, in my experience with more than 10 apps during the last year, the least accurate compared to SKAN. So in case you want to use one of these options, I would start with AEM, as you can work with CPPs as an additional layer of data to compare with.
- Snapchat & Advanced Conversions: The smallest social media among the 5 big players also followed the trend and rolled out Advanced Conversions. They also have quite a lot of information about how this technology works, so I recommend checking the official link: https://businesshelp.snapchat.com/s/article/advanced-conversions?language=en_US
As you can read, this technology is basically following the same function as the other ad networks, since you can use a new way of attribution in order to have real-time data. But it differs from the others we mentioned because you can still have a delay of up to 36 hours after the conversion occurred. This is basically because of the obfuscating process that they do in order to keep users’ privacy.
I have also worked closely with Advanced Conversions, and I have to say that if you work with the same attribution windows as SKAN, it can really help you improve the signals and performance of your Snap campaigns. So I would also recommend testing it against pure SKAN campaigns.
Once we have explained all the main probabilistic technologies that you can use nowadays in the main channels, we have to explain what’s the best and most logical process to follow in order to figure out the real performance of your paid campaigns despite all the discrepancies that you will face using these technologies. best and most logical process to follow in order to figure out the real performance of your paid campaigns despite all the discrepancies that you will face using these technologies.
How can we work with probabilistic attribution?
ThThe million-dollar question, if you have read all the previous points, is clear: How can you deal with all these technologies if you know that you will find discrepancies everywhere once you start to invest in these channels?
In this article, I will give you two different approaches based on the number of channels that you run, which is directly correlated to the budget that you can spend on UA and surely to the size of your company.
First approach: Companies that only run campaigns in one channel
If your company is in this group, let me tell you that everything is not bad when you have budget constraints that force you to stick with one unique channel. You also get one big advantage for being small: the possibility of working with baseline uplifts.
This approach is pretty simple but also pretty effective: since you only have one channel running, you will clearly see an impact on the baseline of trials/subscriptions/installs/your conversion goal if you look before vs. after running the campaigns. Extracting that uplift or difference in conversions will tell you how many conversions your campaigns are actually bringing to your business. It’s important to highlight that this approach is only useful when you maintain all the rest of your marketing activities stable, so you can really attribute all the extra conversions to the new campaigns that you started to run. Otherwise, it would be a mess and you wouldn’t be able to know what is the real driver of the uplift.
Once you know the uplift, you can calculate the real cost of each conversion and then apply the long-term value estimation that you have calculated based on your historical data to see if you reach break-even at some point. Let’s put a quick example to illustrate the approach better:
- Your baseline of trials is 100 per day on average (700 trials weekly)
- You start Meta with AEM during one week and you see that during that week, the campaign has reported 500 trials
- You check your actuals and see that during that week, you actually ended up with 1400 trials
- This means that you actually generated +200 trials that Meta did not report correctly due to probabilistic attribution (700 baseline + 500 reported by the campaign + 200 that Meta couldn’t attribute)
- You can now attribute an extra 200 conversions to Meta and then calculate your “real” cost per trial
- Once you know the actual cost per trial that you have in Meta, you should be able to know how much money a trial will bring to your business in 30, 60, 90 or more days based on your conversion rate and also the LTV that you can easily check in RevenueCat
- Once you have estimated the money that the campaign will eventually bring to you, you can estimate if the cost per trial that you are paying is actually low enough to reach profitability or break-even
- Once you know that, you will know if you need to improve the performance of the campaign by reducing the cost per trial, if you can scale because your math tells you to do so, or if you should give up with Meta and try a different channel because the performance is pretty far from what you actually need to achieve break-even
This approach has helped me scale campaigns from $20K to over $100K in monthly spend in more than five projects in the last two years. The best part is that you can always revise your estimates based on the actual numbers in RevenueCat. This is especially useful because if your projections for LTV and conversion rate are more optimistic than reality, you’ll realize that the campaign is attracting lower-quality users than expected. On the other hand, if your estimates are lower than the actual results, it means the campaign is bringing in higher-quality users compared to your baseline before launching it.
In any case, you’ll be able to reconfigure the projections and always know if the cost per trial that you pay is low enough or not.
Second approach: Companies that can run multiple channels

When different modeling technologies are bringing users at the same time, it is impossible to calculate an accurate uplift for each channel as many variables play at the same time: CPM, CTR, CPIs, CVRs, budgets, etc. So clarifying which part of the uplift is attributed to each channel is basically not possible with the method we explained above.
In these cases, I like working with what I call the four-layer data framework: The first scenario is Blended, the second is SKAN, the third would be based on the modeled conversions reported by the ad networks, and the last one is based on an adjustment factor that we created based on the difference between SKAN, modeled, and blended data.

The four-layer attribution framework.
This method integrates both deterministic (SKAN) and probabilistic (modeled conversions) data while ensuring that your blended performance remains aligned with your business goals.
The process is divided into three steps:
Step 1: Establish a baseline for discrepancies
Since SKAN is deterministic but delayed and modeled conversions can be inflated, the first step is to understand how these two metrics diverge from actual conversions. To do this, track:
- Total trials reported by SKAN per day/week
- Total trials reported by ad networks (Meta AEM, TikTok ADC, etc.)
- Blended total trials (tracked via RevenueCat or internal database)
- Organic trends before running ads
By comparing these data points over a couple of weeks, you can estimate the average discrepancy between SKAN and modeled conversions.
Step 2: Calculate an Adjustment Factor
Since modeled conversions tend to be higher than SKAN, you need to establish a realistic adjustment factor. Use the following formula:

You will get a ratio that you can apply to your campaigns using modeled conversions so you can estimate what’s the realistic number of conversions generated by the campaigns based on SKAN. Moreover, this factor helps to adjust the reality in both ways: when modeled trials are inflated, but also when they’re underestimated.
Step 3: Apply the Adjustment Factor to make decisions over your campaigns
Once you determine the discrepancy rate, adjust your campaigns with the adjustment factor and then follow this logic:
- If SKAN numbers give you profitability based on conversion rate and LTV per trial, then you don’t need to look at anything else. You are ready to scale because deterministic data is telling you to do so.
- If SKAN numbers don’t give you the green light to scale but Adjusted and Modeled data confirm profitability, consider increasing spend and monitoring closely Blended data. If after increasing spend, you see Blended data losing profitability, then you need to stop because the Adjusted and Modeled data was too inflated.
- If SKAN and Adjusted numbers don’t give you profitability but Modeled numbers give you the green light to scale, it’s very likely that the ad network is overattributing conversions and maybe cannibalizing them from organic traffic. In such a case, I recommend checking Blended data and if you keep profitability, you can still try to scale but very cautiously because your Modeled conversions could be too expensive with the increase and you just kept profitability due to Organics, something that can quickly go in the opposite direction with an increasing Cost per Trial on the paid side.
- If SKAN, Adjusted, and Modeled data don’t show profitability but Blended data does, then it surely means that your Organic traffic is huge and you can still scale because with Organics, your overall cost per trial is low enough to cover the investment. I don’t recommend scaling without control in this case because all the campaign data scenarios are not positive, so you will likely need to improve the campaign performance (changing creatives, setups, audiences, etc.)
Conclusion
The key to finding a realistic way to work with probabilistic attribution is cross-referencing all available data points. No single source — whether SKAN, modeled conversions, or blended data — can be blindly trusted. Instead, you must find a way to work with all the data scenarios in order to make the most optimal decision for your budget.
To recap:
- SKAN is deterministic, but delayed and incomplete. It’s still useful, especially for validating modeled data.
- Modeled attribution fills gaps, but often inflates performance. Use it cautiously and apply adjustment factors based on reality checks.
- Blended data reflects the bottom line. Always align decisions with actual revenue and conversion data from tools like RevenueCat.
- Single-channel advertisers can use baseline uplift to find truth.
- Multi-channel advertisers need layered attribution frameworks. The 4-data-layer method helps bring clarity to complexity.
Probabilistic attribution is a very unknown topic, because no one really reveals how their technology estimates conversions. With the two approaches I’ve presented, you will at least be able to have a clearer idea of the reality and direction you should take.